GoJS : Interactive JavaScript Diagrams for the Web
Background
In the recent project, customers commented that there is no updated network diagram for the frequent changes especially involving many network configuration changes. Even with the configuration changes reflected in the project documentations, such documentations are normally not read by the people as relevant information is just a tiny part of documentations.
Therefore a need to reflect such network diagram in a easier manner so people can easily see the latest network layout and configurations. That is when GoJS is discovered.
Introducing GoJS 2.1 (latest)
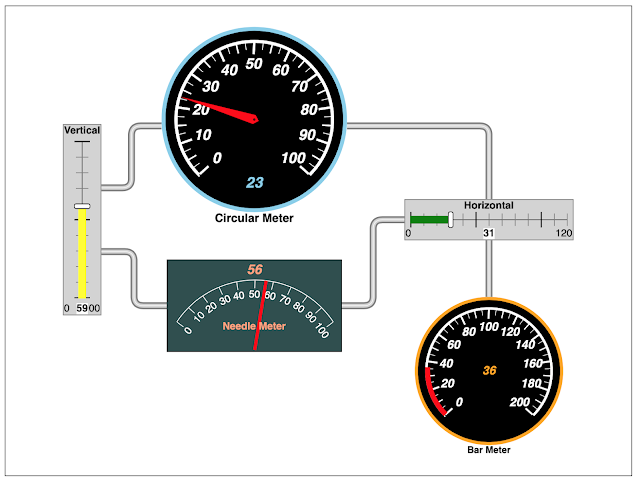
GoJS is a JavaScript and TypeScript library for building interactive diagrams and graphs
From simple flowcharts and org charts to highly-specific industrial diagrams, SCADA and BPMN diagrams, medical diagrams such as genograms and outbreak modeling diagrams, and more. GoJS makes constructing graphs of complex nodes, links, and groups easy with customizable templates and layouts.
GoJS offers advanced features for user interactivity such as drag-and-drop, copy-and-paste, in-place text editing, tooltips, context menus, automatic layouts, templates, data binding and models, transactional state and undo management, palettes, overviews, event handlers, commands, extensible tools for custom operations, and customizable animations.
Removing GoJS Evalution Watermark
You could use GoJS with Unlimited Evaluation, however you will see the Evaluation Watermark at the top left corner of your diagram as displayed in the diagram below:
To remove the watermark
STEP 1: Open the extracted GoJS folder where you extracted the site.zip where you downloaded the latest GoJS binary.
STEP 2: Go to release folder.
STEP 3: Locate go.js file. Open up with your favorite Text Editor.
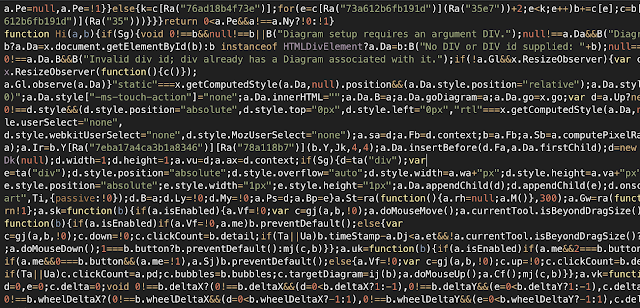
STEP 4: Perform search for the following string "7eba17a4ca3b1a8346".
STEP 5: Replace the string highlighted with red box with the following "a.Ir = function(){return true}"
STEP 6: Save the go.js file. Now the line should look like the following:
STEP 7: Reload your diagram, and you should see the Evaluation Watermark is gone.
Happy creating your interative diagrams.


